
Optimizing Your Home Assistant Dashboard: A Comprehensive Guide based on real use case
Let's find out how to optimize the Home Assistant dashboard by having all the parameters at hand in less space.
TUTORIAL


In the realm of smart home management, the Home Assistant dashboard serves as the gateway to the intricate web of automation and control that powers our connected environments.
A well-crafted dashboard not only reflects the pulse of our homes but also ensures that crucial information is easily accessible, available and comprehensible at a glance.
So many parameters to monitor can be a nightmare for the end users, whose main goal is to benefit from their smart homes, especially when they interact with their dashboard via a mobile device.
My installation of Home Assistant began with a configuration that evolved day after day.
Thanks to the experience I gained, I endeavored to make the best use of the tools provided by Home Assistant, optimizing as much as possible how the the data are mixed together and reported.
In this guide, I'm going to share my experience and a real use case, bringing to the table the tools I am currently using to enhance the visualization of the key parameters related to my home.
Ready to go ?
Procedure
Before delving into the details of how I optimized my dashboard, let me provide a brief description of its original organization.
I had configured a specific view in which there were several entity cards, each one related to a specific room. These cards were used to display different parameters of my home:
Software configuration
Home Assistant version 2024.1.6
HACS installed in your Home Assistant's environment. Please refer to this article for more details
The Multiple entity row repository downloaded from HACS
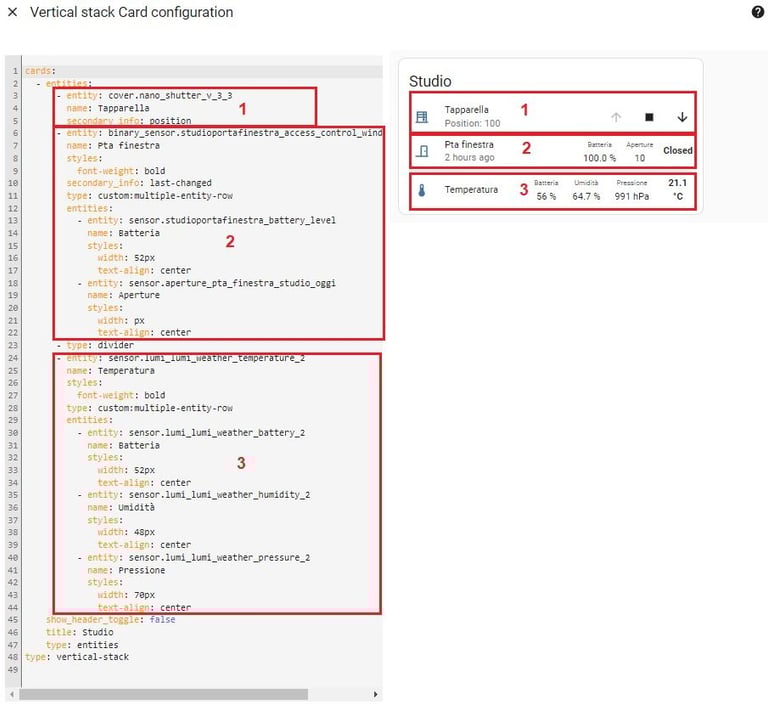
As you can see, there has been a clear optimization of the occupied space (8 rows versus 3 rows) and, the usage of the bold style has helped to highlight some of the parameters reported.
Of course, the same technique can be applied to different parts of your dashboard. My advice is to set up your dashboard and use it for a while.
This allows you to assess its actual usability and identify where it is necessary to introduce changes to enhance how the parameters related to your home are reported.
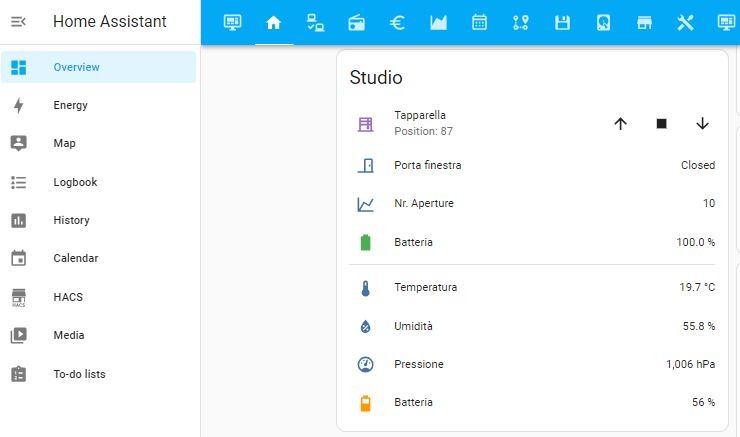
This setup was nice but it occupied a significant amount of space, necessitating continuous scrolling on a mobile device.
To optimize my dashboard, I've incorporated the multiple entity row into my configuration. This special tool allows for multiple entity states and attributes to be displayed on a single entity's row.
It's essential to highlight that this is not a standalone card but rather, a row element for the entities card.
Below is the code related to the same room as depicted in the image above and, on the right side, the final result:
I truly hope you found this new article helpful.
To stay ahead with the latest tips, tricks and in-depth guides, ensure you're subscribed to my newsletter about Home Assistant. By doing so, you'll be the first to know about my upcoming tutorials!
Not only that, but your newsletter subscription grants you access to all the previous articles, ensuring you don't miss out on any valuable insights.
Thank you for being a valued part of my community! 🚀✨